4.1. Analysis of Phenotypic Traits and a Model for Clustering Breeds by Phenotypes (PCM)
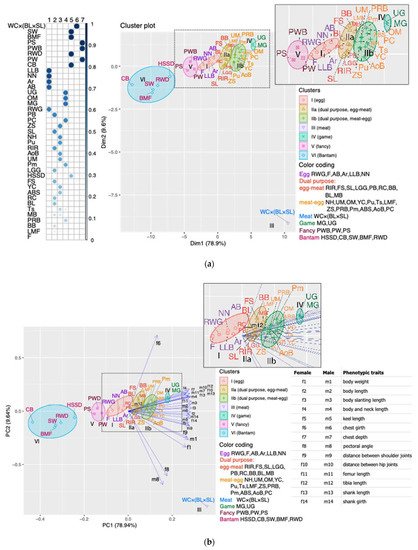
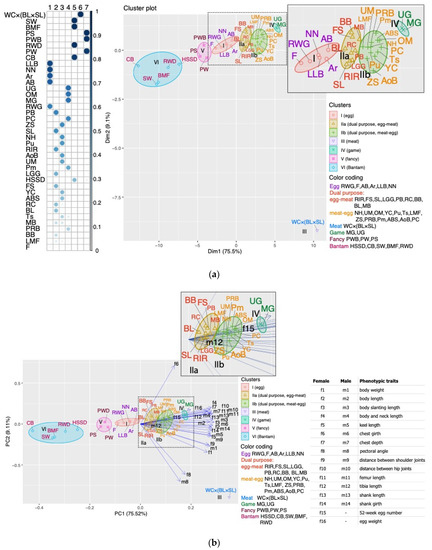
To preserve and use the available poultry genetic resources effectively, priority should be given to phenotypic characterization [52,53]. Phenotypic traits, primarily body weight and linear body measurements, are not only of economic importance, but also significant, alongside genetic parameters, in the classification of domestic animals, their assessment, and the search for ways to improve their productivity (e.g., [3,54,55,56]). Phenotypic and morphometric evaluation is often used in chicken breeding because it is simple, quick, and cost-effective (e.g., [3,53,57,58,59]). Body measurements are not uncommon in assessing the diversity of indigenous chicken breeds (e.g., [53,56,59,60]).Based on the phenotypic diversity analysis of a wide range of global chicken gene pool breeds, we constructed PCM and compared it with TCM. For this purpose, we took phenotypic characteristics reflecting the morphometric parameters of the breeds including body weight and 13 body measurements of hens and cocks, as well as two main traits of egg productivity: egg number for 52 weeks of life and egg weight (Figure 1). We have shown that morphometric characters provided the greatest contribution to the formation of the breed clustering pattern in accordance with the PCM. This was clearly seen on the FAC and PCA plots (Figures S1a and S2a), in which the morphometric characters were used alone (i.e., without egg production traits), while fully resembling the PCM pattern. If clustering was achieved only based on egg production traits, the PCM pattern was disrupted (Figures S1b and S2b). At the same time, if we compare the characteristics of egg number and body weight, we can see that the contribution of the former to the clustering of breeds significantly exceeds the contribution of the latter (Figure 2 and Figure S1a,b). Thus, we can assume that among the morphometric and all phenotypic traits in general, the main contribution to PCM seems to be made by the traits of body measurements in females and males. Moiseyeva et al. [3] stated that body measurements, being quantitative traits, have a high heritability coefficient (h2 ≈ 0.5) and a lower intrapopulation variability. These features determine their high correlation with the genetic structure of breeds that was created over a relatively long evolutionary process of their development.To the best of our knowledge, the proposed assessment of phenotypic diversity using phenotypic clustering of chicken breeds that we designated PCM, as well as the assessment of the contributions of certain phenotypic traits to this PCM, have not been specifically and purposefully examined in other previous studies. It is noteworthy that we carried out such assessments using quite a vast part of the world gene pool of chicken breeds that have different origins (often mixed), purpose of use, and the degree of admixture. Moiseyeva et al. [3] were also able to demonstrate good distinguishability of phenotypic (morphometric) traits to reproduce plausible breed differentiations and topologies of appropriate phylogenetic trees, even using smaller samples of 8–10 different breeds.Our research not only has confirmed the main insights of the work by Moiseyeva et al. [3], but also significantly expanded them. Due to a larger sample of the global gene pool, including a great number of synthetic breeds and populations, and in the light of the clustering data obtained, we were able to revise the concept of four main evolutionary lineages of breed formation in domestic chickens as postulated by Moiseyeva et al. [3], which embraced ETBs, MTBs, GBs, and BTBs. According to our updated concept based on PCM, it is also necessary to distinguish two more evolutionary branches of chicken breeds, namely DPBs and FBs (Figure 1a,b). The PCM postulated by us and the appropriate concept of six major evolutionary lineages of chicken breed formation would, in our opinion, most fully reflect the entire spectrum of phenotypic diversity of the world gene pool of domestic chickens.It should also be noted that our concept of evolutionary subdivision of domestic chickens and breed formation based on PCM also has certain discrepancies with TCM adopted in conventional and specialized literature on poultry (e.g., [32]). TCM is grounded on a rather simplified, speculative, and, to a certain extent, very artificial scheme for dividing chicken breeds into conditional utility types, i.e., purposes of use, when only one criterion for selecting poultry for egg or meat productivity can determine if a breed belongs to a certain TCM class. This traditional approach does not consider history of the origin (often mixed) and development of this breed, the degree of its synthetic nature and introgression, as well as the whole complex of its phenotypic features. This also results in significant artificiality, fuzziness, and uncertainty in terms of a defined phenotypic characterization and classification among numerous synthetic breeds from the EMB and MEB subcategories, which are commonly referred to as DPBs. The FB class looks no less artificial and speculative in TCM because it involves any breeds (including BTB) kept by fanciers for their phenotypic diversity and not related to explicit ETBs, MTBs, and GBs. Our proposed concept and PCM produced through an appropriate analysis of the phenotypic diversity of chicken breeds would highlight and correct the said shortcomings of TCM.
4.2. Genotypic Models of Clustering and Admixture
Concerning the development of two genotypic clustering models (GCM1 and GCM2), in a number of instances we noted both their congruence with each other and some similarities with PCM. For example, breeds and populations from the GCM2 cluster I were fully included in the GCM1 subcluster Ia (ETB), and members of the GCM2 subcluster IVa in the GCM1 cluster III (MTBs). Breeds of the PCM cluster V (FB) were stably clustered together in the GCM1 subcluster Ia and in the GCM2 cluster III, etc. The existing differences between the models can be attributed to the various algorithms used to construct them, and to the differences in the nature of the compared traits. It should also be noted that, for PCM, we used a fairly wide set of phenotypic traits describing both morphology and performance characteristics of poultry, while for genotypic models, one region of the chicken genome corresponding to the NCAPG-LCORL locus was employed, which apparently narrowed the resolving power of analyzing the breeds and populations by genotypes. Many other investigations including Moiseyeva et al. [3] also observed an unequal contribution of certain sets of phenotypic/genetic factors to the resulting patterns of phylogeny/clustering among examined breeds.Nevertheless, combining data on genotyping (i.e., allele frequencies in the five SNPs) and on their grouping according to PCM showed significant differences between groups (clusters) of breeds and an expected topology of the breed phylogenetic tree (Figure 3) in full accordance with our proposed updated concept of the evolutionary subdivision of domestic chickens into six evolutionary lineages of breed formation. In addition, the observed differences at the NCAPG-LCORL locus between the identified groups (clusters) of breeds did not contradict the previous information on the relationship of variability at this locus with certain phenotypic traits (e.g., [50,51,61,62]). Considering the above, we would suggest the importance of our findings at the NCAPG-LCORL locus that demonstrated a genetic variability among a wide sample of commercial, local, and fancy chicken breeds, including synthetic ones, which largely overlaps with the patterns of their phenotypic variability and does not contradict the general ideas about history of formation and development of a particular breed.An important aspect of our study was the detection of significant admixture among the 49 genotyped chicken breeds and populations. This was expressed in complex patterns of admixture models (Figure S6), which, as a rule, did not allow us to clearly distinguish among themselves the classes (clusters) that we proposed for four models (TCM, PCM, GCM1, and GCM2). This significant admixture can be explained by the history of mixed origin of the studied breeds, i.e., a synthetic nature of their formation, when genetic makeup of many breeds was composed by mixing the genomes of several original, distinctive breeds and/or due to individual crossbreeding events with other breeds and introgression during their breeding (e.g., [63]). Nevertheless, by exploring the obtained patterns of admixture models, one could generally notice certain differences between ETB and MTB chickens, which is consistent with the results of the genotype frequency analysis. We would also suggest that the admixture models themselves can be considered as an auxiliary tool in clarifying evolutionary signatures of subdivision and inference of demographic history among chicken breeds and populations.
4.3. Analysis of Genetic Variation at the Locus NCAPG-LCORL
Characterization of genetic variation and population genetic structure based on SNPs at key chicken performance-related genes not only helps to determine the characteristics of various commercial, fancy, and local breeds and populations, including synthetic and highly admixed ones, but also to assess whether this information can be useful in MAS [50,64]. We genotyped chickens of various purposes of use (TCM) and phenotypes (PCM) using the Illumina Chicken 60K SNP iSelect BeadChip, which revealed the presence of the five significant SNPs on GGA4 in the area of the NCAPG-LCORL locus and flanking regions.The differences found at the genetic level, i.e., in the SNPs within the locus covering the NCAPG-LCORL genes may be of great interest, since these genes are one of the key regulators of RNA polymerase II transcription and have pleiotropic effects in terms of body weight/size and egg weight/size [65,66]. Guo et al. [67] identified genomic variants associated with the size and mass of chicken bones at the NCAPG-LCORL locus. SNPs at the NCAPG gene (rs14491030) and the LCORL gene (rs14699480) were associated with egg weight [68]. According to Yi et al. [17], rs14491030 at the NCAPG gene can simultaneously affect both egg weight and body weight. In an investigation by Barkova and Smaragdov [69], significant associations of rs14491030 at the NCAPG gene with egg weight and shell elastic deformation were found. Sun et al. [70] showed that NCAPG had a definite effect on the eggshell quality in pullets. The pleiotropic effect of the NCAPG-LCORL locus may be related to the fact that egg weight affects the body weight of chickens at birth, their physical shape and further performance [71]. Eggshell, providing gas exchange between an embryo and environment and supplying calcium to embryo bones, is of biological importance for the development of avian embryos [72]. In a study by Liu et al. [61], the LCORL locus was significantly associated with the body weight of chickens. It was also shown that the LCORL gene has different levels of expression in slow-growing and fast-growing broiler chickens.
In the present investigation, we found that following even TCM, ETB chickens in general were significantly different from chickens of other purposes of use (utility types). So, for the GGaluGA265969 substitution, significant differences were shown when comparing the ETB–MTB and ETB–FB group pairs. Presumably, such differences could be due to the fact that this SNP might be associated with the body weight of hens.
SNP rs15619223 showed the largest number (28) of significant pairwise differences between chicken groups of various use/productivity types (TCM) or various clusters/subclusters (PCM and GCM1) (SI S3). According to our previous studies [50,51], this SNP is probably associated with body weight and egg weight in RW chickens. Although for SNPs GGaluGA265966 (14 significant pairwise differences), rs14491028 (14 differences), and rs14491017 (23 differences) we did not find any other reports on their relationship with productive traits in chickens, the presence of polymorphism and a significant difference in allele frequencies between groups of contrasting chicken breeds (SI S3) would suggest considering these SNPs as potentially momentous.In general, for three models, TCM, PCM, and GCM1, we demonstrated a reliable resolution of the obtained data on allele frequencies in the SNPs of the NCAPG-LCORL locus to discriminate chicken breeds and populations related to ETBs, MTBs, DPBs (EMBs, MEBs), GBs, or FBs (SI S3). Thus, based on our own data available for the region on GGA4 that involves NCAPG-LCORL, we can confirm that there is a definite relationship between genetic variation at this locus and phenotypic diversity in chicken breeds, and this is an important QTL for body weight and egg weight [61].The maximum heterozygosity for a particular locus is achieved when the frequencies of its alleles are equal and depends on the number of alleles. This is relevant for populations under selection for a desired trait. In the conditions of artificial breeding of populations, parental pairs are assorted, while relationship of individuals participating in mating increases. As a result of mating closely related individuals (i.e., inbreeding), proportion of homozygous genotypes is growing in a population. An important feature of inbreeding is the constancy of allele frequencies in all inbred generations observed while the number of heterozygous genotypes declines [73]. In our study, we used closed gene pool populations with a small population size and identified isolated cases of inbreeding (see Section 3.2.1). However, due to paucity of the studied populations, assessment of the inbreeding level in them would be possible with full confidence in further detailed genome-wide studies.
Among the identified SNPs, a shift in genetic equilibrium was found in crossbred chickens Ts × SL and in purebred populations Ts, NH, Pu, F and PRB (χ² > 3.84), which may be indicative of strong selection pressure and a consequence of the selection of offspring from the best sire.
In the SNP-assisted analysis of genetic differentiation between chicken groups using TCM and paired FST, significant differences were detected for ETB chickens in comparison with MTBs, EMBs, GBs, and MEBs, as well as MTBs and FBs. With applying PCM (Table 2), greatest FST distances were shown for FBs relative to other clusters. These results of the FST-based analysis suggest a certain “predictive power” of the five SNPs for discriminating chickens of different other groups (clusters) when employing TCM and PCM.The five significant SNPs identified in this study overlapped with the previously established QTLs for egg weight, egg production and growth traits at the NCAPG-LCORL locus (SI S4), confirming that these SNPs are relevant to and important for evaluating genomic variation among the studied local, commercial and fancy chicken breeds.In the present study, we also investigated LD structure at the LCORL gene among various chicken breeds. Close LD was observed in the FS, CB, and BB breeds, suggesting their common origin as the Cochin, Brama, Dorking, and Houdan were FS ancestors. Chickens of the ZS breed were developed by crossing the RW, RIR, NH, and YC breeds. PC, such as NH, was created using the RIR breed [31]. The common origin of the listed breeds could explain their almost complete identity in LD. A similar conformation and diminutive sizes of the BMF and PS chicken breeds probably determined the same structure of their LD patterns. This may be due to the fact that polymorphism in the LCORL gene in animals can have a significant effect on the height, skeletal size, bone formation, and muscle development during embryogenesis [62].
When examining LD haploblocks between the SNPs in the studied chicken populations, important information was obtained regarding a population specificity of the haploblock structure at the NCAPG-LCORL locus for the 11 breeds/populations. These included two ETB populations (RWS and RWP), two EMB populations (FS and BB), three MEB populations (NH, PC and ZS), two FB populations (PS and PW), and two BTB populations (BMF and CB).
LD analysis revealed 36 haplotypes for these breeds. Common haplotypes are confirmed by the origin of breeds and similar phenotypes, suggesting a common mechanism for the formation of these LD patterns. Four similar haplotypes in the three MEB (NH, PC, and ZS) breeds, as well as one more common haplotype in NH and PC, can be associated with their common descent from the same ancestral breeds.
Due to the intensive selection in the breeding program and a significant reduction in the population size, changes in LD were observed in the chicken gene pool populations over several generations. Characterization of LD is of fundamental importance in carrying out genome-wide association analysis and genomic selection, as well as in identifying recent genomic rearrangements. LD can make a certain positive contribution when used in MAS in the future poultry farming [74]. At the same time, the costs of genotyping SNPs can be significantly reduced since markers are usually linked with each other in the area of influence on a trait [75]. Comparative assessment of populations with different demographic histories is an important source of information on changes in the genome when breeding small groups and assessing the results of crossing [64,76].
Source